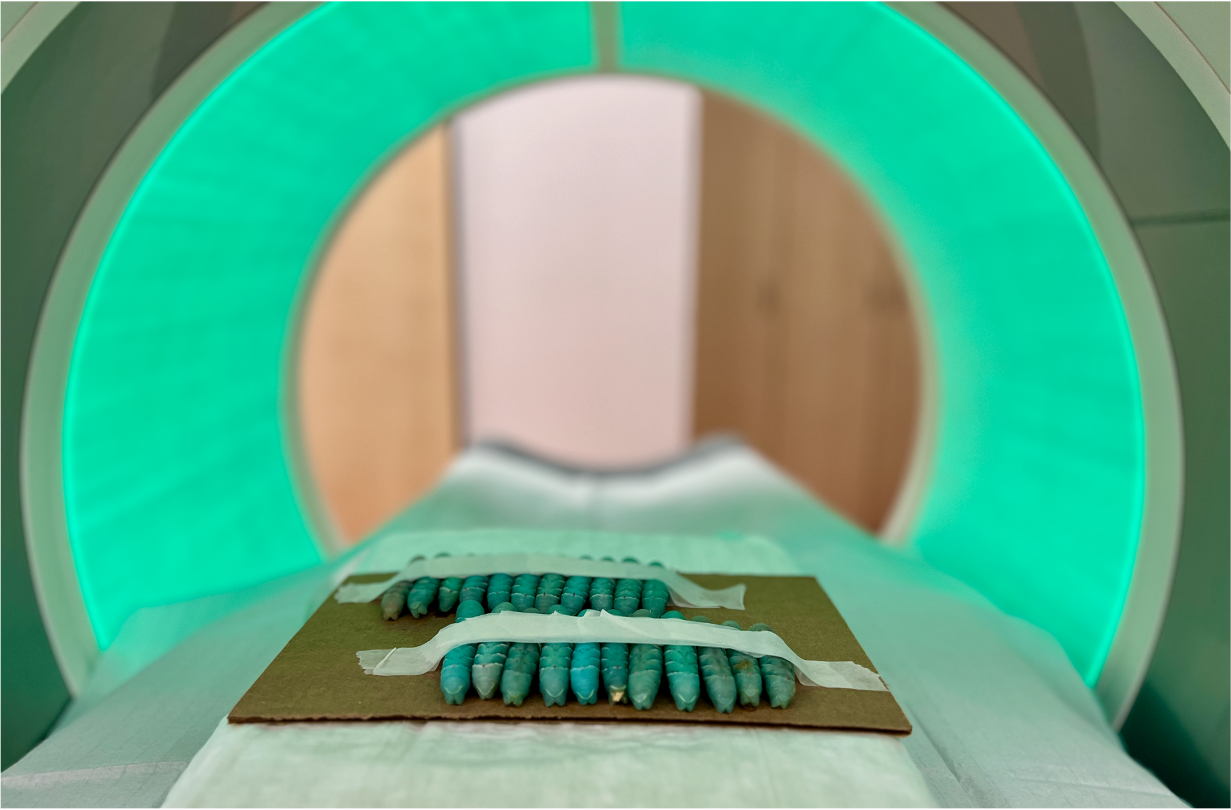
CT (Computed Tomography)
Computed Tomography (CT), also known as CAT scan (Computerized Axial Tomography scan), is a medical imaging technique used to create detailed cross-sectional images of the inside of the body. It combines a series of X-ray images taken from different angles and uses computer processing to create detailed cross-sectional images, also known as "slices" or "sections," of the body's internal structures.
You may also be interested in other methods, concepts, or the models we work with:
© Anton Windfelder
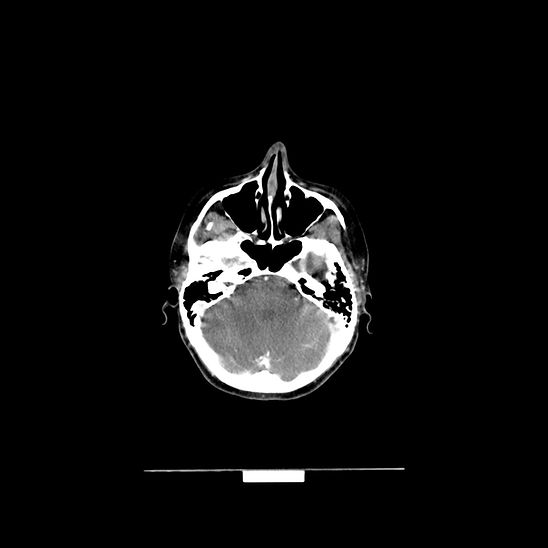
COMPUTED TOMOGRAPHY
The basic concept of computed tomography (CT) is most comprehensible by understanding the principle and limitations of conventional radiography. In conventional radiography, emitted X-ray photons differently penetrate the patient or sample. The interaction and attenuation of X-ray photons with the sample or the patient are tissue-dependent (Figure 1). Tissue properties like density, thickness, and the atomic number (z) of abundant elements within the tissue determine the X-ray attenuation in different biological tissues (Figure 1A).
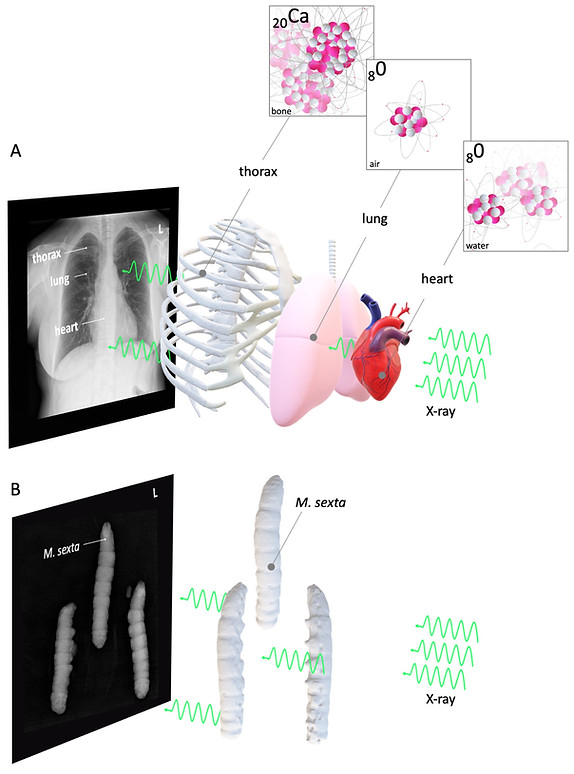
Figure 1: Basic concept of radiography
© Anton Windfelder
Figure 1A shows a conventional radiography: Here, the bones' calcium with a high density and high z effectively stops X-rays from crossing the patients' thorax. On the other hand, the patients' lungs are filled with low - dense gas with a lower z than calcium (e. g. oxygen in Figure 1A), which only weakly attenuates the generated X-rays. As a consequence, the X-ray detector behind the patient detects a signal, which is in analogy to old X-ray grayscale films, by convention black. The calcium-dependent heavy X-ray attenuation of the compact thorax bones is indicated as a bright (white) signal. The patient's heart muscle has an intermediate X-ray attenuation, which is indicated as a gray signal. Figure 1A and B are also showing the limitations of conventional radiography. Since the X-ray source and the sample are stationary, the anatomy is shown as two-dimensional superimposed images of different radiodense tissues.
CT overcomes this limitation by employing a rotating X-ray source coupled with rotating detectors. This setup allows the scanning of thin axial cross-sections of the sample, allowing a 3D reconstruction of the sample (Figure 2).

Figure 2: Basic concept of computed tomography (CT)
© Anton Windfelder
The most common X-ray source in CT systems are rotating anode X-ray tubes (or the more advanced rotating envelope vacuum vessel tubes, Figure 3A). Here, electrons are liberated due to thermionic emission at the cathode. A high voltage potential between the cathode and the anode produces an electron beam, which travels through the vacuum and hits the anode. Most of the kinetic energy is converted to heat. Therefore, the rotating anode, housed in close proximity to a cooling medium, is needed to prevent overheating. X-rays are generated via Bremsstrahlung and Characteristic X-rays emission (Figure 3B). Here, electrons are either deflected by positive nuclei of the anode, which results in the emission of a photon (X-ray) or ejecting inner shell electrons of the anode, which are replaced by outer shell electrons, releasing characteristic photons (X-ray) (Figure 3B). While the energetic spectrum of the Bremsstrahlung X-rays varies, the spectrum of Characteristic X-rays is of discrete quantity. The interaction of medical diagnostic X-rays within the patient (or sample) is regularly limited to the Photoelectric effect and Compton scattering (Figure 4C). In general, the energy of the used X-rays should not exceed 100 keV since Compton scattering dominates the X-ray matter interactions beyond 100 keV, which lowers the X-ray images' quality to Compton scattered photons (Figure 4A-C). Unfortunately, this is only possible in paediatric radiology with small patients. In adult radiology, higher energies beyond 100 keV are needed. Therefore, a scattering grid is used to compensate for the resulting Compton scattering. The Photoelectric effect is generally preferred for diagnostic imaging since the ejected electrons are not registered in the X-ray detectors.
The most common X-ray detectors are scintillation detectors. In those detectors, incoming X-rays induce the emission of visible light, which is amplified by a photomultiplier and registered as an electric signal (Figure 4D).
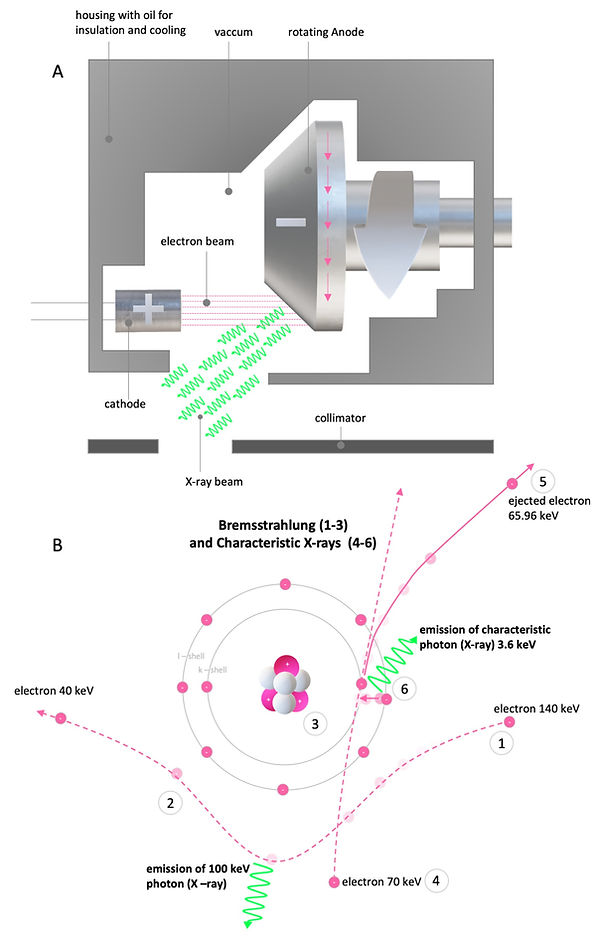
Figure 3: Generation of X-rays
© Anton Windfelder
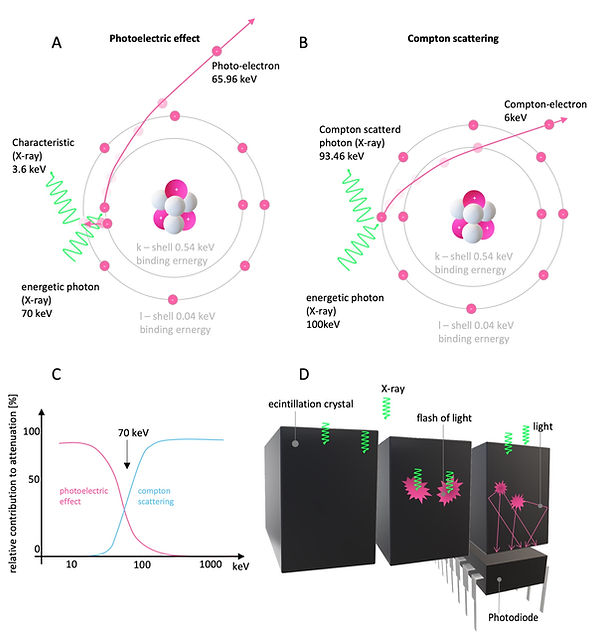
Figure 4: X-rays interaction with matter and X-ray detectors
© Anton Windfelder
How are CT images measured and computed?
Like radiography, the principle of CT is based on the tissue-specific attenuation of X-rays. To create a superposition-free axial CT image, it is necessary to produce rotational attenuation profiles of the sample of at least 180 °, better 360 °. The X-ray beam's primary intensity (I0) generated by the X-ray tube must be measured (Figure 5). For the sake of simplicity, we assume monochromatic radiation and a simple inhomogeneous phantom resembling Manduca sexta after CA application. Then, the attenuated X-ray (I), which has traveled through the sample, is measured as:

With I and I0 the attenuation P can be calculated as indicated below:

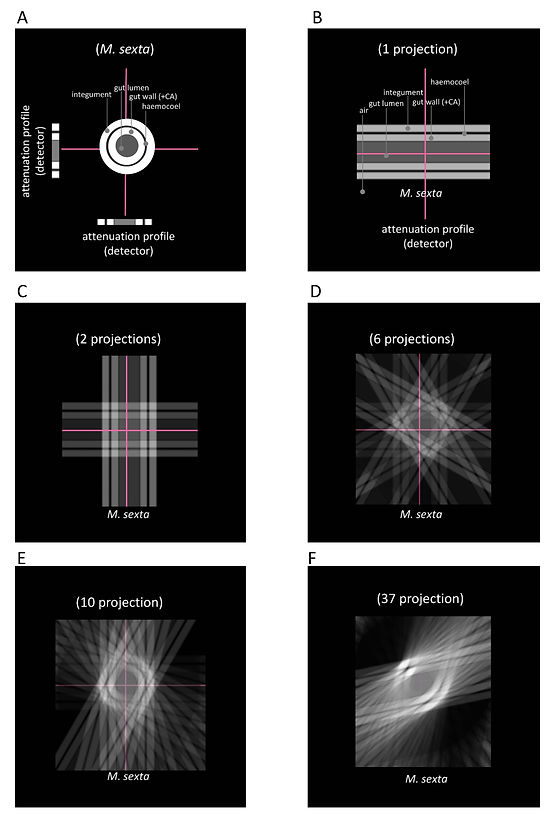
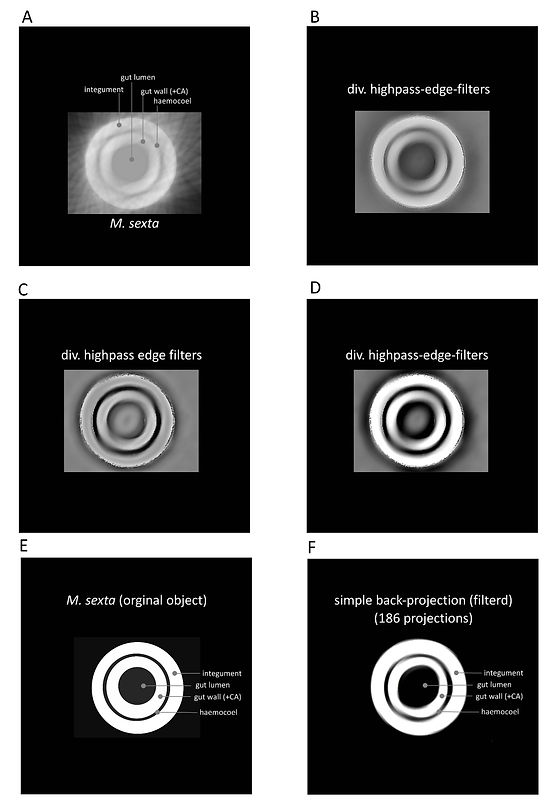
If the absorber thickness d is given, the attenuation coefficient 𝜇 can be determined. For the creation of a CT image, the local distribution of the attenuation coefficients (𝜇) along the attenuation line must be specified. One way to understand the determination of 𝜇 along the attenuation line is due to the algebraic reconstruction technique (ARC) (Figure 6). In Figure 6A-D, a 3 x 3 matrix is used as an example. ARC determines 𝜇 in computing the unknown values (pixel values in the matrix) by solving equations along the attenuation lines. If enough (also oblique) attenuation lines are given, the matrix of linear equations can be solved. The calculated attenuation coefficients (𝜇) are then displayed as gray values on a grayscale, which generates the CT image. Although ARC is easily comprehensible, the computational power that is required to create a single axial CT image with sufficient resolution is extremely high. Therefore, another procedure called filtered convolution- or filteredback-projection is used. This method is illustrated with a simple back-projection in Figure 7. The attenuation profile of an axial projection of an L5 M. sexta larvae after CA injection (Figure 7) is projected repetitiously with a varying angle. After ten projections, the integument and gut wall's ring-like structure begins to appear (Figure 7E). For feasibility reasons, the final projection number was limited to 186 (Figure 8A). The back-projected image was then enhanced with different high pass- and edge enhancing filters (Figure 8B - F). In the real CT filtered-backprojection, the attenuation profiles are filtered first and then projected. Since modern computer system are almost capable of computing images with ARC, new iterative approaches are combining the two presented techniques.
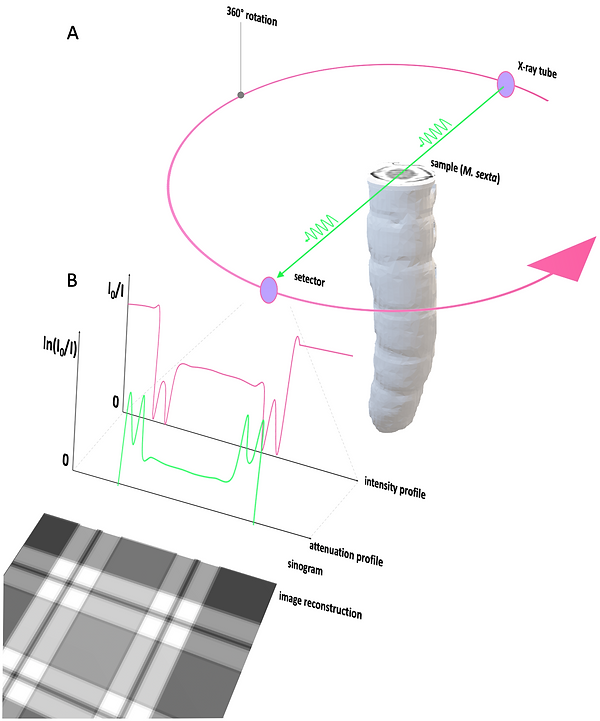
Figure 5: Image generation in CT imaging
© Anton Windfelder

© Anton Windfelder
Figure 6: Algebraic reconstruction technique ARC to compute the attenuation coefficient 𝜇
© Anton Windfelder
Figure 7: Simple back projection of M. sexta after application of CA
© Anton Windfelder
Figure 8: Filtering of simple back projection of M. sexta after application of CA
Once the spatial distribution of 𝜇 is measured and calculated, it is represented as CT values (with the unit Hounsfield, HU) on a matrix with a grayscale of 4096 gray values. To permit the comparability between different CT systems, the CT value is shown in relation to water attenuation:

On the Hounsfield scale, water (e.g., urine) has, by definition, a CT value of 0 HU, air a CT value of -1000 HU. Compact bone can reach CT values of up to + 1000 HU. Most soft tissues have CT values between + 20 and + 70 HU and cannot be mistaken, in contrast to MR imaging, as fat with an approximate CT value of - 100 HU (Figure 9).
Most human observers can distinguish approximately 60 - 80 gray values, which results in a drastic loss of accessible information for most human observers using the full HU scale. Therefore, the HU scale is adapted to the CT value of interest, which is called windowing. The center of the window corresponds to the tissue of interest, and the window width defines the contrast of the image. CT values below the window width appear entirely black, and CT values beyond the window width are shown homogeneously in white.

Figure 9: CT value and Hounsfield scale
© Anton Windfelder
© Anton Windfelder
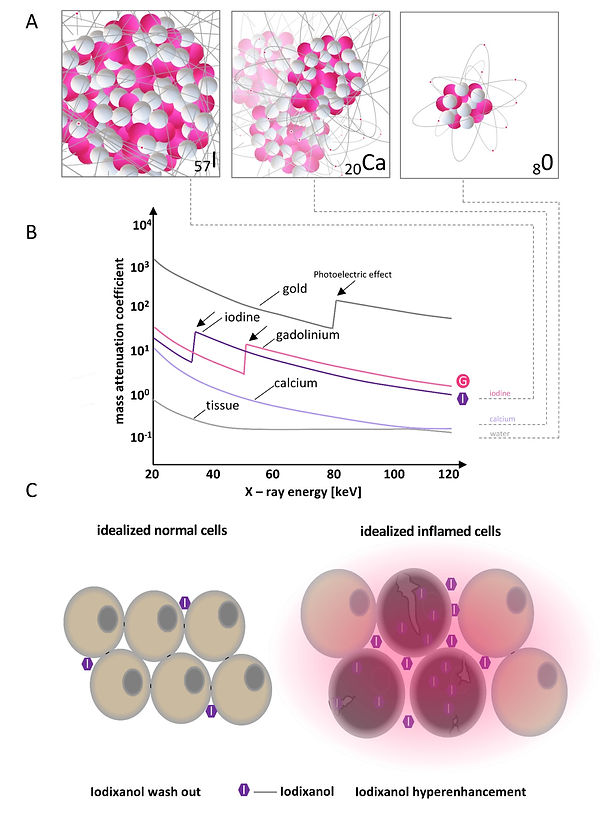
Figure 10: Mass attenuation coefficient different materials and mode of action for iodinated extracellular radiocontrast agent
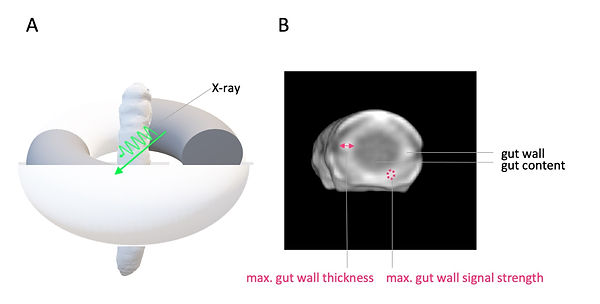
Contrast agents in CT imaging are mostly based on iodine (Figure 10). Iodine has a high atomic number (z) of 57 and, therefore, a high Mass attenuation coefficient in comparison to other elements in biological tissue. Most iodinated extracellular radiocontrast agents are exploiting the same differential pharmacokinetics to enhance pathological lesions as the used MR contrast agent (Gd-BOPTA, see MRI, Video 1, Figure 10 and Figure 11). Hence, for the phenotyping of colitis-like lesions in M. sexta, we used the same well-established imaging findings of gut inflammation like in MRI (postcontrast maximal gut wall thickness and post-contrast maximal gut wall signal strength, Figure 12). Note that the preselected X-ray energy can be used to further enhance the attenuation of iodine due to the Photoelectric effect (Figure 10B).
© Anton Windfelder
Video 1: Mode of action: extracellular contrast agents in CT/MRI

© Anton Windfelder
Figure 11: Renal cell carcinoma after CA in arterial, venous and delayed phase
© Anton Windfelder
Figure 12: M. sexta in CT imaging and imaging findings for phenotyping of colitis-like lesions


